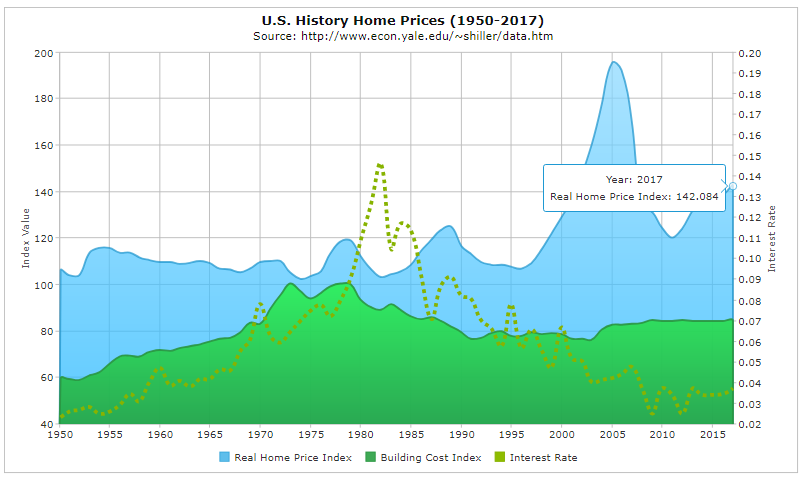
Blazor Chart

jQWidgets Chart for Blazor is a feature complete charting component built on top of Blazor and jQWidgets framework. It offers rich functionality, excellent performance, easy to use and well documented APIs, and many examples. Like all widgets in the jQWidgets framework it works across devices and has a consistent look and behavior on PCs, tablets and mobile phones. The component is an ideal solution for complex Blazor UI applications. Trusted by thousands of companies, continous improvements with frequent releases, excellent support, and big user community.
Highlights
- Plug-in free
- Runs on mobile, touch devices and PCs
- Optimal rendering across browsers
- Web Standards Compliant
- Optimized for Performance
- Easy to use APIs
- Built-in color palettes
- Data binding to XML, CSV, TSV, JSON, JSONP
Unique features
jQWidgets Chart for Blazor JS is part of the the jQWidgets UI Toolkit and delivers a combination of advanced features and capabilities for the next-generation of cloud-enabled Web Apps and modern Web sites. The Chart works across platforms, devices and browsers and provides high quality plug-in free data visualization.
Data Binding
jQWidgets Chart for Blazor JS has a built-in data binding logic designed to support multiple data sources and handle large datasets. The chart supports several data binding modes optimized for the most common integration scenarios:
Local Data - requires minimal effort to load data from local array.
Xml Data - Chart can be loaded from XML data using Ajax request.
JSON Data - Chart can be loaded from JSON data using Ajax request.
CSV Data - Chart can be loaded from Comma-Delimited data using Ajax
request.
Tab Data - Chart can be loaded from Tab-Delimited data using Ajax request.
Remote Data - You can populate the Chart using JSONP. JSONP (JSON with Padding) represents
a JSON data wrapped in a function call. JSONP is an effective cross-domain communication
technique used for bypassing the same-origin policy limitations.
Chart Types
jQWidgets Chart for Blazor supports several common chart types. You can easily plot series of different types on a common chart. A type must be specified for each series group. Currently the Chart supports the following series:
- column - simple column series
- stackedcolumn - stacked column series
- stackedcolumn100 - percentage stacked columns
- line - simple streight lines connecting the value points
- pie - circular chart divided into sectors, illustrating proportion
- donut - donut series
- bar - bar series
- candlestick - candlestick financial series
- ohlc - ohlc financial series
- bubble - data is displayed as a collection of bubbles
- scatter - data is displayed as a collection of points
- stackedline - stacked lines
- stackedline100 - percentage stacked lines
- spline - smooth lines connecting the value points
- stackedspline - smooth stacked lines
- stackedspline100 - percentage stacked smooth lines
- polarseries - polar series
- spiderseries - spider series
- area - area connecting the value points with streight lines
- stackedarea- stacked area with streight lines between the points
- stackedline100 - percentage stacked area
- areaspline - smooth area connecting the value points
- stackedareaspline - smooth stacked areas
- stackedareaspline100 - percentage stacked smooth area
- waterfall - waterfall chart